Getting started with Barlytics
Barlytics is an inventory and operations platform built for bars and restaurants. It brings counts, invoices, point of sale, and ordering into one place — so you can spend less time chasing spreadsheets and more time running the floor.
This guide walks through the four steps that get a new location up and running.
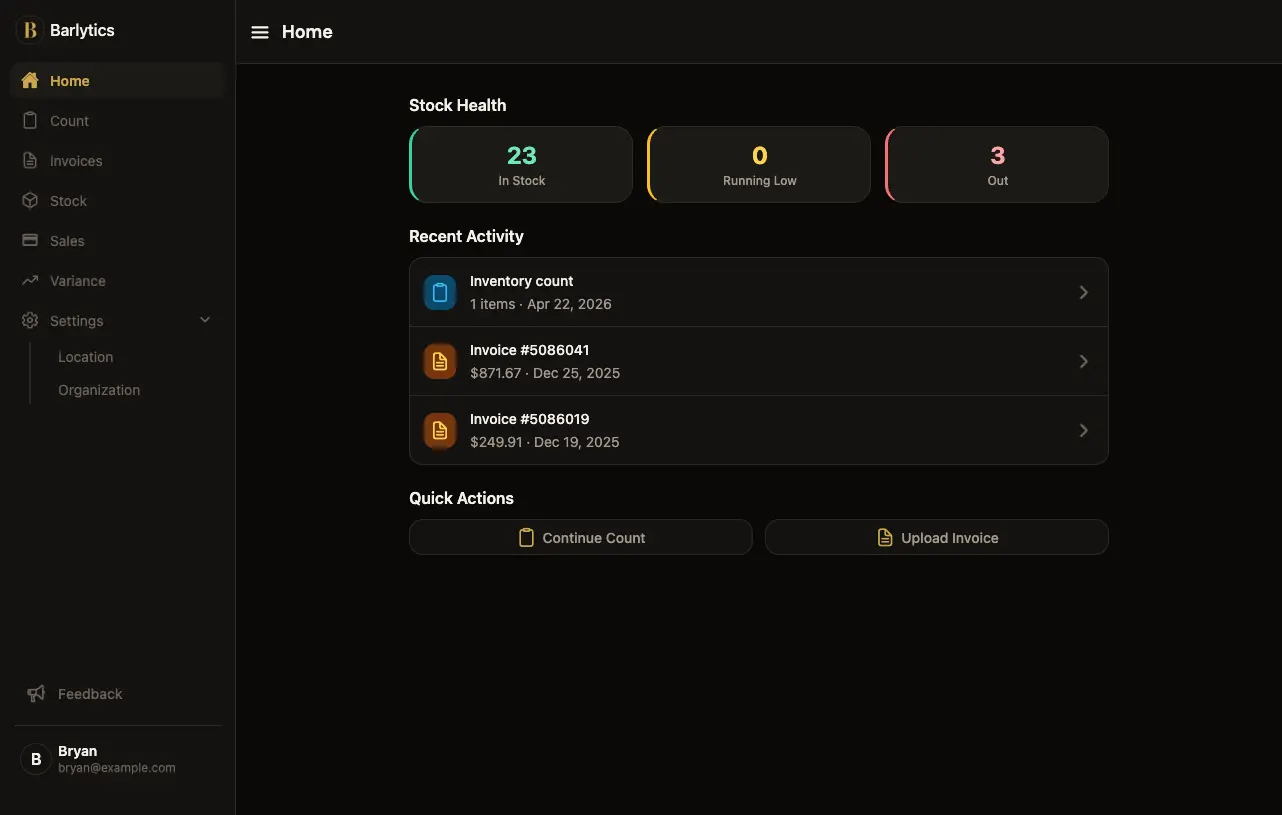
How it comes together
Most bar and restaurant operators already know the pain points: counts that never quite match, invoices buried in a drawer, pours that don't line up with tickets, and an order list that's half guesswork. Barlytics replaces that patchwork with one workflow that connects:
- Real stock levels — counted consistently and kept current automatically.
- Invoices in seconds — captured from a photo or document, not hand-keyed.
- Sales-linked consumption — every ticket mapped to a recipe and a product.
- Variance tracking — so you can see where product, and money, is leaving the door.
The rest of this guide provides a setup overview to unlock all of it.
1. Establish your inventory baselines
Start with a fresh count. A clean baseline is what every downstream number — consumption, variance, ordering — will be measured against, so it's worth getting right on day one.
You have two ways to build it:
- Count zone-by-zone. Walk the bar, the backbar, the walk-in, and each storage area, adding products one at a time to the zone they live in. Barlytics will remember the layout for every count after this one.
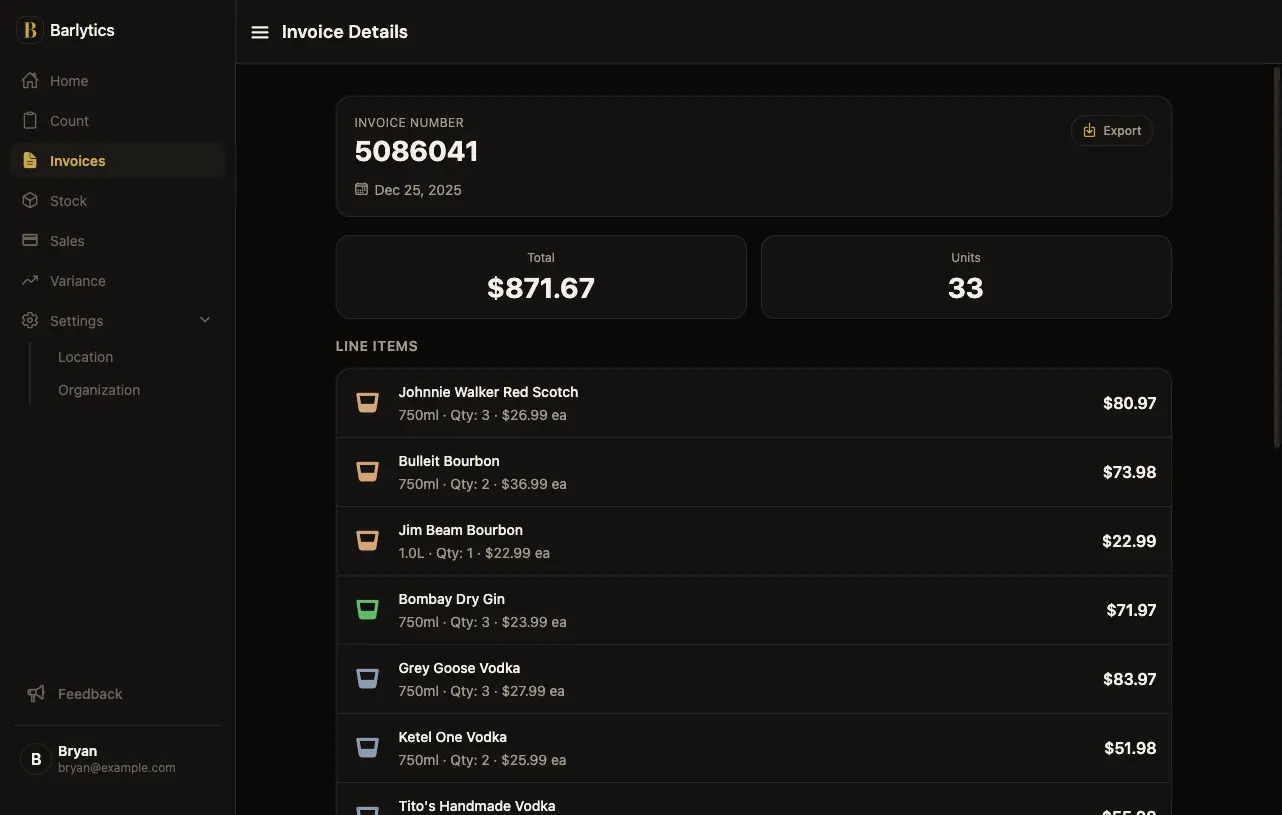
- Import from recent invoices. Snap a photo of a recent invoice or upload a PDF and Barlytics will pull out the line items, match them to products, and scaffold the catalog for you. This is the fastest way to stand up a full product list without searching products by hand.
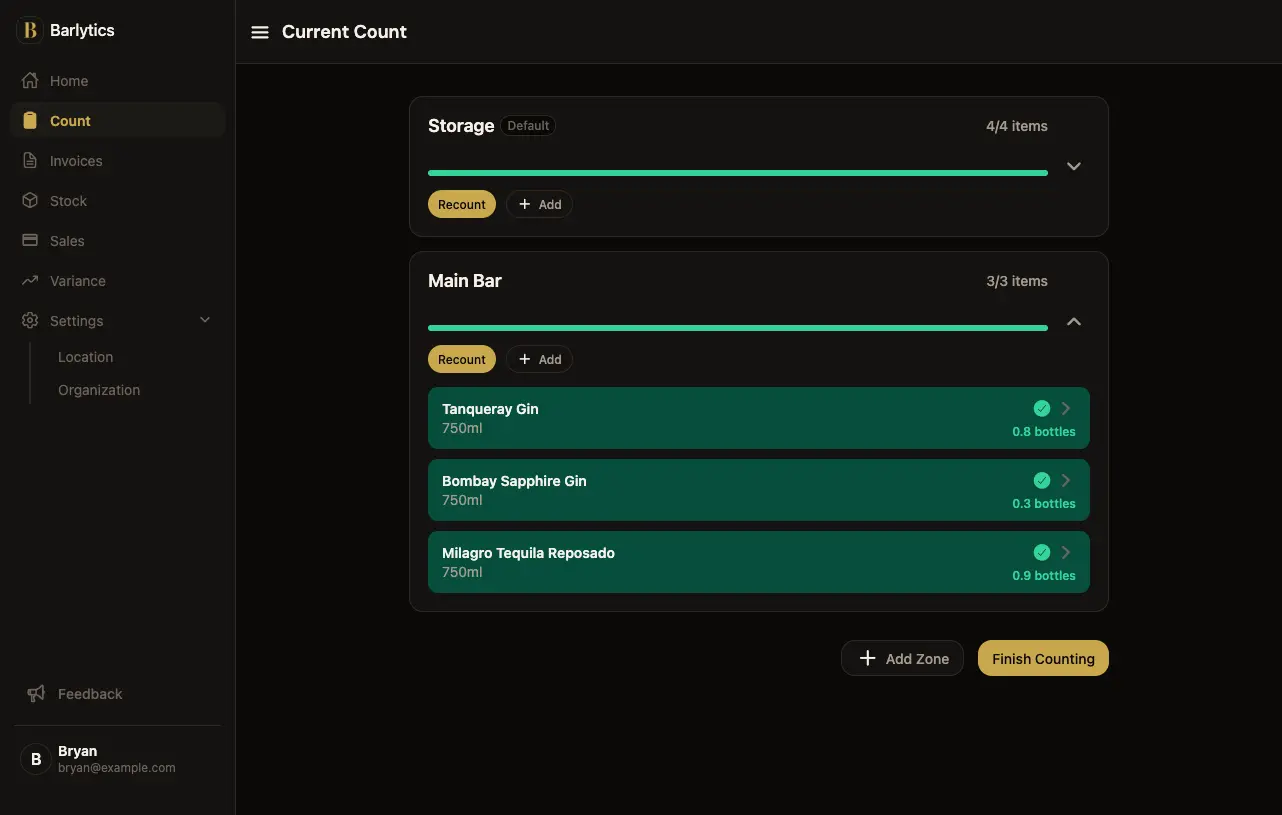
Most locations mix both approaches: invoice import to get the catalog in place, then a physical count to set opening quantities.
Tip: Don't try to be perfect on the first count. What matters is that every bottle on the shelf is represented. You can refine par levels and recipes after a week of real data.
2. Connect your point of sale
Once the catalog is in place, connect your POS. Barlytics pulls in the last 30 days of tickets immediately, which does two things for you:
- It scaffolds recipes from the item + modifier combinations your staff actually rings in.
- It gives you a month of real sales history to start calibrating par levels and variance against.
After the initial import, a daily automatic sync keeps tickets flowing in, so product consumption and stock levels stay current without additional work.
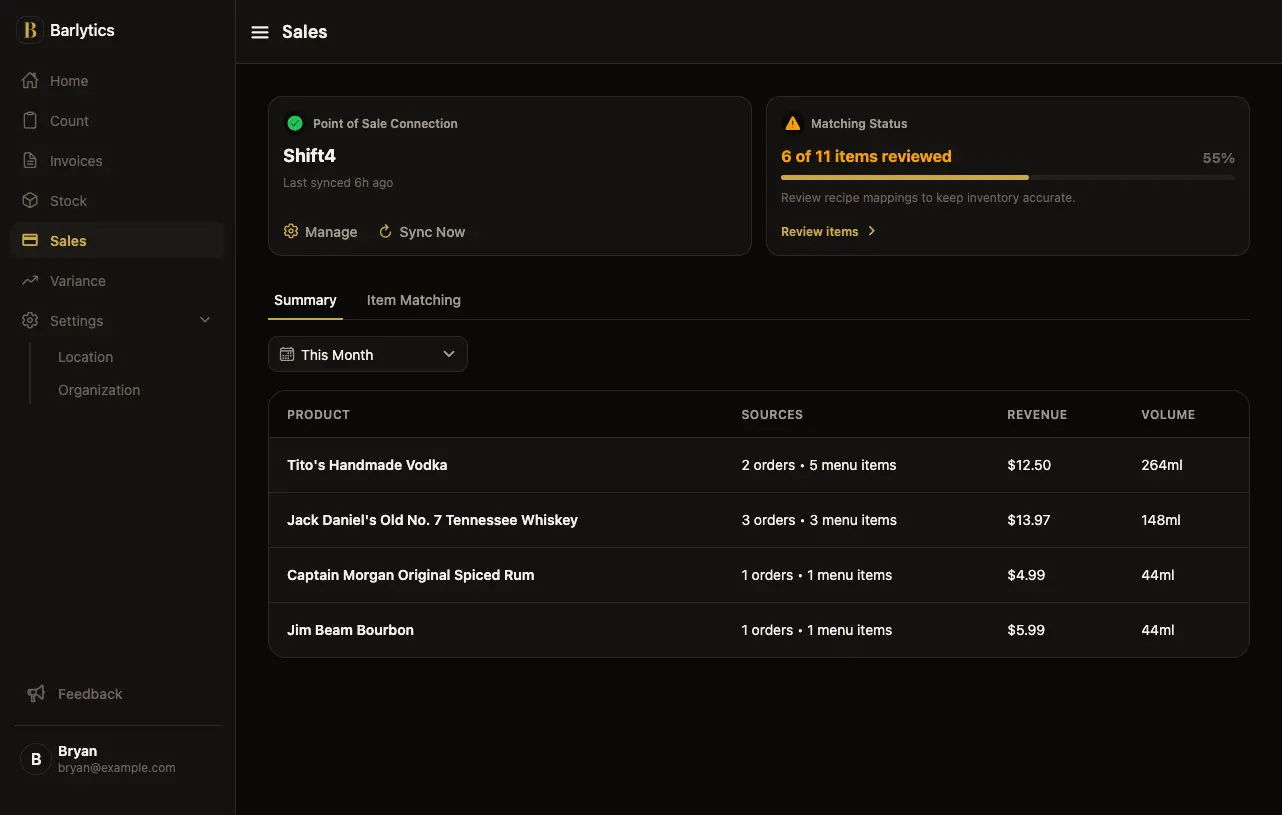
Match tickets to ingredients
Each ticket item + modifier combination gets matched to the ingredients it pours. Once a match is in place, every future sale of that item deducts the right quantity from the right product automatically.
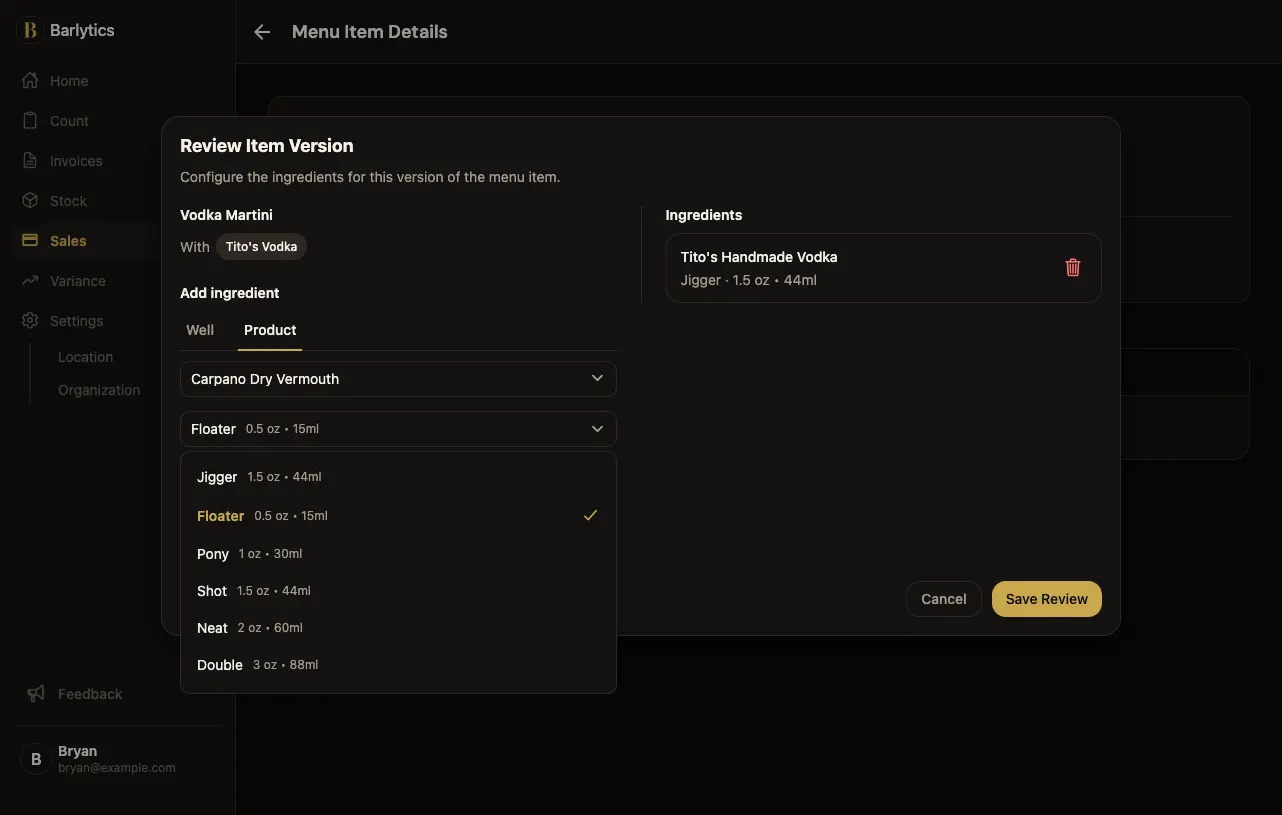
You only have to match a combination once. New items that arrive from the POS surface in a queue for quick review, and anything already matched just flows through.
3. Automate variance tracking
With consistent counts coming in and POS data matched to recipes, you can see variance in one place — the gap between what should have poured based on sales and what actually left the shelf based on counts.
Variance is where the money hides. Over- and under-pouring, comped drinks that never got rung in, breakage, transfers, theft — they all show up here, product by product, shift by shift.
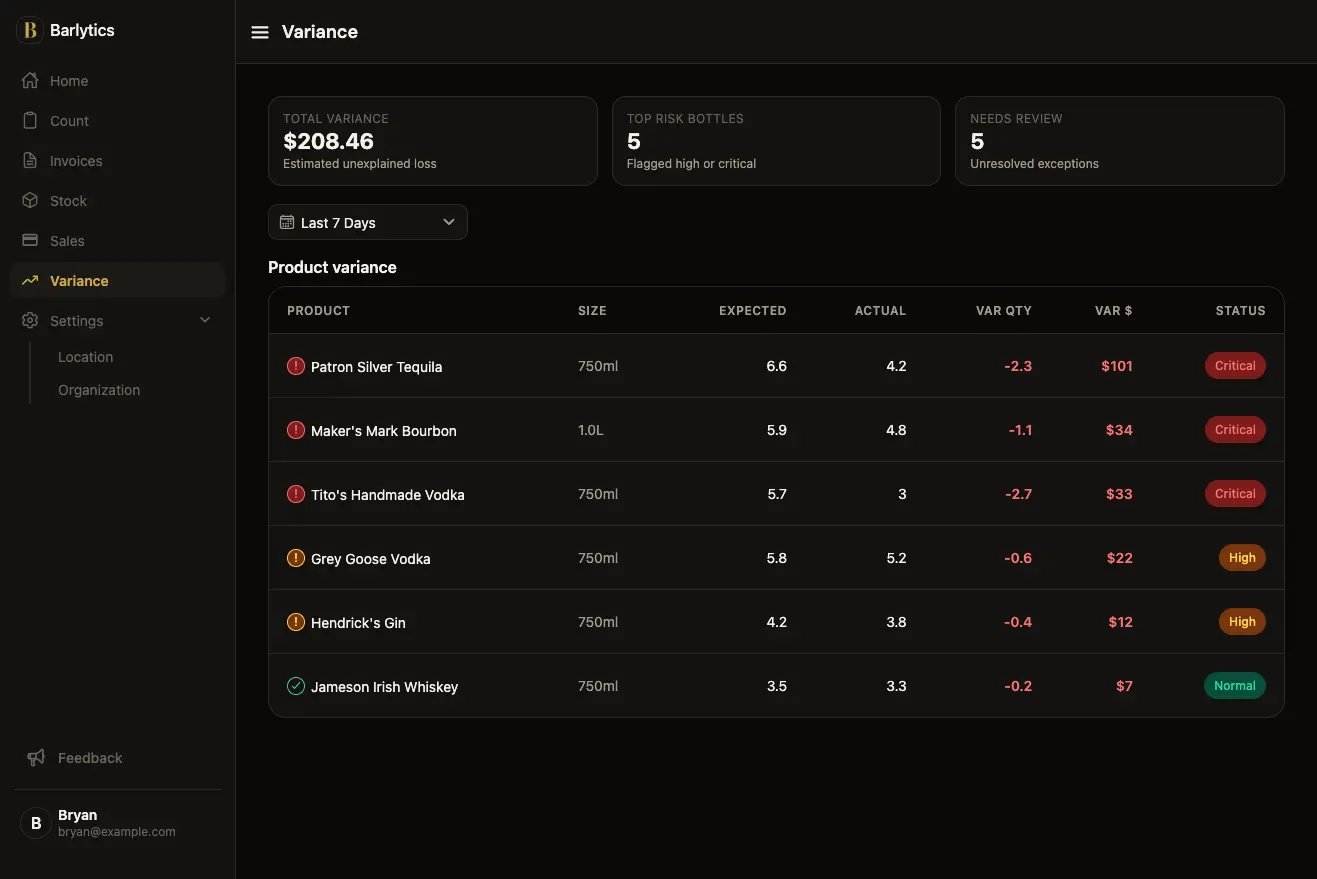
You'll use this view to:
- Spot products that consistently run short against sales.
- Compare variance across shifts, bartenders, or locations.
- Validate that a recipe change or a new pour policy actually moved the number.
The more consistent your counts, the tighter the variance signal gets. A weekly cadence is a good place to start.
What's next
More features and improvements are landing regularly — deeper forecasting, more POS and distributor integrations, sharper reporting. If any of this sounds useful, we'd love to hear from you.
Interested in a demo, or just want to say hey? Email the team and we'll get back to you within a business day.